Matt Stiles looks at Census data and notes a political point.
Seven Texas counties — Rockwall, Williamson, Collin, Hays, Fort Bend, Montgomery and Denton — are listed among the nation’s 30 fastest-growing areas, according to U.S. Census Bureau estimates released [Tuesday].
They are also Republican-voting counties, according to results in the 2008 general election. Sen. John McCain won these counties by a 20-point margin, well over 240,000 votes.
It’s actually a hair shy of 260,000 votes – Stiles had missed Rockwall County in his initial post, and though he added it in for an update, he did not re-do the math. There’s a bit more to this than that, however. Let’s have a look at how these counties voted in 2004:
County       Name   Party     Votes     Total    Pct
====================================================
Collin       Bush       R   174,435   243,370  71.67
Collin      Kerry       D    68,935   243,370  28.33
Denton       Bush       R   140,891   200,237  70.36
Denton      Kerry       D    59,346   200,237  29.64
Fort Bend    Bush       R    93,625   162,347  57.67
Fort Bend   Kerry       D    68,722   162,347  42.33
Hays         Bush       R    27,021    47,131  57.33
Hays        Kerry       D    20,110    47,131  42.67
Montgomery   Bush       R   104,654   133,282  78.29
Montgomery  Kerry       D    28,628   133,282  21.71
Rockwall     Bush       R    20,120    25,440  79.09
Rockwall    Kerry       D     5,320    25,440  20.91
Williamson   Bush       R    83,284   126,401  65.89
Williamson  Kerry       D    43,117   126,401  34.11

Total        Bush       R   644,030   938,208  68.64
Total       Kerry       D   294,178   938,208  31.36

Total      McCain       R   699,183 1,139,175  61.38
Total       Obama       D   439,892 1,139,175  38.62
Putting it another way, those counties had about 200,000 more voters in 2008 than in 2004. 145,000 of those new voters – 72.5% – voted Democratic, 55,000 voted Republican. That’s change I can believe in, but it shouldn’t come as a surprise. Obama did do about five and a half points better overall in Texas than John Kerry did, going from 38.22% to 43.68% of the absolute vote (38.49% to 44.06% in the two-party matchup). It would be strange indeed if he didn’t markedly improve on 2004 in these counties. Notice, however, that he improved by a point and a half more than he did in the state as a whole. That’s a good trend, too.
To which you may say, “Oh sure, compare a historic election for which Democrats were super-excited to one where a highly popular Texas Republican President was on the ballot. That’s fair.” Well, how about we compare the election of 2002 to the election of 2006? Since there are no Presidential candidates, I’m going to look at a couple of Supreme Court races, because 1) they’re usually more about party identification than anything else, and 2) we have a couple of races with similar R/D performances: Margaret Mirabal versus Steven Smith in 2002, and Bill Moody versus Don Willett in 2006. Here are the numbers:
County        Name   Party     Votes     Total    Pct
=====================================================
Collin       Smith       R    88,762   122,655  72.37
Collin     Mirabal       D    33,893   122,655  27.63
Denton       Smith       R    69,899   100,260  69.72
Denton     Mirabal       D    30,361   100,260  30.28
Fort Bend    Smith       R    47,008    84,153  55.86
Fort Bend  Mirabal       D    37,145    84,153  44.14
Hays         Smith       R    14,238    26,129  54.49
Hays       Mirabal       D    11,891    26,129  45.51
Montgomery   Smith       R    53,977    71,428  75.57
Montgomery Mirabal       D    17,451    71,428  24.43
Rockwall     Smith       R    10,148    13,304  76.28
Rockwall   Mirabal       D     3,156    13,304  23.72
Williamson   Smith       R    46,480    71,981  64.57
Williamson Mirabal       D    25,501    71,981  35.43


County       Name    Party     Votes     Total    Pct
=====================================================
Collin     Willet        R    82,834   125,348  66.08
Collin      Moody        D    42,514   125,348  33.92
Denton     Willet        R    63,475    99,380  63.87
Denton      Moody        D    35,905    99,380  36.13
Fort Bend  Willet        R    49,953    92,843  53.80
Fort Bend   Moody        D    42,890    92,843  46.20
Hays       Willet        R    13,644    27,775  49.12
Hays        Moody        D    14,131    27,775  50.88
Montgomery Willet        R    54,018    74,650  72.36
Montgomery  Moody        D    20,632    74,650  27.64
Rockwall   Willet        R    10,331    14,233  72.58
Rockwall    Moody        D     3,902    14,233  27.42
Williamson Willet        R    43,193    75,659  57.09
Williamson  Moody        D    31,466    75,659  42.91

2002 Total               R   330,512   489,910  67.46
2002 Total               D   159,398   489,910  32.54

2006 Total               R   317,448   508,888  62.38
2006 Total               D   191,440   508,888  37.62
Once again, improvement by the Democrats across the board. Dems picked up 32,000 voters, while the Rs lost 13,000. It’s not an exact apples to apples comparison because there was a Libertarian candidate in 2006, but even if you assign all of his votes (23,730 in these seven counties) to Willett, the Dems still have a 32,000 to 10,000 advantage in voters gained. All without any of that hopey-changey stuff.
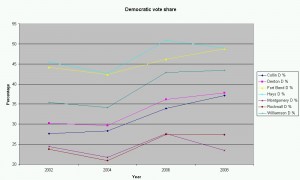
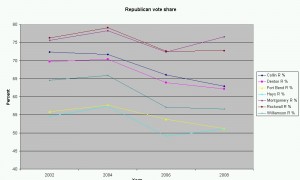
If you want to see the effect in pictures, I’ve got you covered there as well:
The GOP vote share ticked up a bit from 2006 to 2008 in Montgomery, and to a lesser extent in Hays, but overall the trends are pretty clear. It’s especially clear when you simply compare 2002 to 2006, and 2004 to 2008.
Does any of this mean anything for 2010? Well, elections are all about the candidates, and every election is different, and blah blah blah. What I’ll say is simply that these counties start out with a higher floor for Democrats than they had eight years ago – I’ll be surprised if Bill White doesn’t carry Fort Bend and Hays, and he has a decent shot at Williamson, too – and I expect that this year there will be a lot more organizing done in them as well; in some cases, that may be the first time there’s been a real, funded, organizing effort. All things being equal, that should certainly have a positive effect. The whole point of this exercise was to show that while these counties are still challenging territory for Democrats, they’re a lot friendlier overall than they once were, and the prospect of them being the fastest growing areas in the state is not a daunting one for the Ds.


Nice work, and encouraging data.
Wow. Excellent stuff Kuff!
Good work Kuff. I live in DFW and the days of general election GOP coronations in even ruby red counties like Denton and Collin are over. Minorities are moving out there because of the schools and cheaper housing, and bringing their Democratic voting habits with them. I wouldn’t be surprised if Denton or Collin have a Democratic state rep by the end of the decade if not sooner depending on the way the districts are drawn. And the ruby red suburban counties aren’t as red as there were in say 2002. The problem is the rural counties in east texas are getting redder fast.
Pingback: Eye on Williamson » Texas Blog Round Up (March 29, 2010)
Pingback: Texas Progressive Alliance Weekly Round Up « TexasVox: The Voice of Public Citizen in Texas
Pingback: Population and voting trends: 2004 and 2008 Presidential election – Off the Kuff
Pingback: Population and voting trends: 2004 and 2008 judicial elections – Off the Kuff
Pingback: Texas Progressive Alliance Round-Up Has Risen For Another Week « Texas Liberal