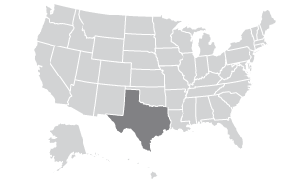
YouGov has an updated poll of Texas.
Republican challenger Mitt Romney gets a solid majority of the votes of likely voters over Democratic President Barack Obama in Texas, 55% Romney to 41% Obama, in a YouGov poll of 958 likely voters from the Lone Star state (recontacted from an initial September poll).
In the race for Senate, Republican Ted Cruz holds a 51%-36% lead over Democratic candidate Paul Sadler in the race to replace the retiring Sen. Kay Bailey Hutchison.
[…]
Sampling method: Respondents were initially selected on September 7-14 from YouGov’s panel using sample matching. A random sample (stratified by age, gender, race, education, and region) was selected from the 2005–2007 American Community Study. Voter registration, turnout, religion, news interest, minor party identification, and non-placement on an ideology scale, were imputed from the 2008 Current Population Survey Registration and Voting supplement and the Pew Religion in American Life Survey. Matching respondents were selected from the YouGov panel, an opt-in Internet panel.
Respondents were recontacted on October 4-11 for the second wave of the YouGov poll. The percentage of likely voters who were successfully recontacted was 83.4%.
Weighting: The sample was weighted using propensity scores based on age, gender, race, education, news interest, voter registration, and non-placement on an ideology scale.
Number of respondents: 958 likely voters. Margin of error ±4.5% (adjusted for weighting).
The September result they refer to above showed Romney leading by a 52-41 margin. If I understand their methodology correctly, they asked the same people from September again in October, and applied a likely voter screen, the details of which they do not share. After fiddling around with a margin of error calculator, I estimate they had a weighted sample size of about 475.
Here’s their September data and here’s their October data. If you just look at the unweighted numbers on page 3 of each, the results are very similar. In September, 500 out of 1087 unweighted respondents (46.0%) said they voted for Obama in 2008, and 487 out of 1090 unweighted respondents (44.7%) said they were voting for Obama this year. Putting it another way, Obama’s 2012 level of unweighted support was 97.1% of his 2008 level of unweighted support. In the October sample, 385 out of 874 unweighted respondents (44.1%) said they voted for Obama in 2008, and 391 out of 906 unweighted respondents (43.2%) said they were voting for Obama this year. Putting that another way, Obama’s 2012 level of unweighted support was 97.8% of his 2008 level of unweighted support. How they get from there to those weighted numbers, I got no clue. I presume some of that weighting is to correct for the oversample of white voters (74.2% in September, 75.8% in October), but the final, weighted racial distribution is unknown. For what it’s worth, Obama did better among Hispanics in the unweighted October sample than he did in September (61-35 versus 55-33) but worse among independents (39-48 versus 40-40). Make of all that what you will. It’s another data point, and I’ve added it to the sidebar.
One more thing to note is that I can’t recall seeing any mainstream media coverage of either of the two YouGov polls. That crappy Lyceum poll was cited everywhere, and the Wilson Perkins poll got a lot of play, too. Of course, they’re both in-state pollsters, and they clearly did a fair amount of publicity of their efforts, whereas if it hadn’t been for the Tuesday night dKos elections polling wrap I’d have had no idea about the new YouGov numbers. To me, that says that YouGov needs to do a better job letting people (i.e., the media) know they’re out there, and the media needs to broaden their web horizons.


Pingback: Eye on Williamson » TPA Blog Round Up (October 22, 2012)
Pingback: UT/TT: Romney 55, Obama 39 – Off the Kuff