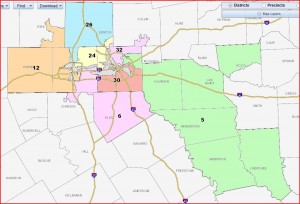
Continuing with the Redistricting Plans From An Alternate Universe series, we’ve seen the Veasey-West proposal, now here are two more from the Senate debate. First, we have Sen. Carlos Uresti, who presented an amendment to Plan C136 that was aimed at drawing a Hispanic opportunity district in the D/FW area. Here’s a look at that:
The gray blob in the middle is labeled CD33; you have to zoom in closer to see it in the viewer. It looks a lot like the MALDEF CD35 that was proposed back in April. Not sure why Uresti labeled his district CD33, but that’s not important. The point of this, of course, is to demonstrate that such a district could be drawn. At the time, some folks complained about how ugly the MALDEF CD35 was. All I can say is that it sure ain’t any uglier than the Seliger-Solomons CD35.
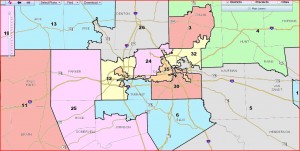
Sen. Uresti’s amendment was limited to the Metroplex. (He had another amendment to Plan C130 that contained these same districts plus proposals for CDs 25 and 1.) Sen. Mario Gallegos put forward a full statewide substitute, Plan C131. Here’s a look at his proposal for the Metroplex:
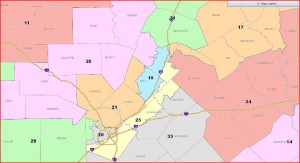
Again, to my eyes, that looks a lot like the MALDEF district, only he calls it CD35 as well. Here’s his view of Central Texas:
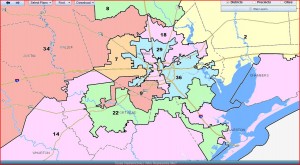
Lloyd Doggett gets restored to CD10, while CD23 migrates in a similar fashion as the Veasey plan. Where the rubber really meets the road is in Harris County:
Voila, a new Hispanic opportunity district in Harris County. You can bet your sweet bippy that will make an appearance in a lawsuit near you.
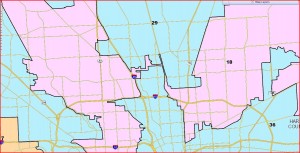
You may be wondering about that weird boundary between Gallegos’ proposed CD36 and CD29. Here’s a closeup view:
Yeah, not exactly a work of art, but it does keep the African-American neighborhoods on the north side together. Right now, a lot of Latino precincts are in CD18; in this plan, they get separated out into CDs 29 and 36. After what the GOP did to advance its goals, don’t come complaining to me about this kind of dark magic.
A spreadsheet with 2008 electoral data for the Gallegos plan is here. Here are the Obama and Houston numbers, with districts grouped by likelihood of being won by one party or the other:
Safe R

Dist    Obama   Houston
=======================
01      30.40     37.01
02      34.61     41.93
03      37.38     36.80
04      29.28     37.55
05      35.37     40.18
07      35.87     35.62
08      26.88     30.91
11      23.20     28.77
13      22.24     27.48
14      32.34     36.63
19      26.96     31.73
21      36.75     35.19
22      38.64     40.40
25      28.78     31.69
26      35.09     35.21
34      33.94     36.48


Likely R

Dist    Obama   Houston
=======================
06      43.06     44.93
12      40.91     41.54
17      40.08     43.59
24      41.17     40.74
31      42.61     42.47
32      43.31     43.66


Likely D

Dist    Obama   Houston
=======================
29      58.10     59.58
33      53.77     57.56


Safe D

Dist    Obama   Houston
=======================
09      69.62     69.60
10      63.60     59.96
15      56.11     60.48
16      64.73     66.90
18      70.21     69.45
20      63.65     64.38
23      59.06     60.00
27      57.39     60.80
28      58.50     61.43
30      74.76     75.04
35      66.20     67.89
36      60.71     65.59
Remember that district numbering varies between these two plans. Under the Gallegos plan, CD10 is Doggett’s district, CD36 is the Harris County Hispanic opportunity district, CD33 is in South Texas, CDs 25 and 34 are in Central Texas, north and east of Austin, respectively; I’d say CD34 is Mike McCaul’s district, and CD25 is “new”. I don’t really think CD29 is less than safe for the Dems, but by my basic rule of needing to be above 60% in each of the two categories it qualifies only as Likely. Note that the effect of creating CD36 is to make all other Harris County districts less Democratic, as you’d expect. CD33 is more competitive, though not all downballot Republicans topped 40% there. Gallegos puts extra Hispanic districts in Harris County, South Texas, and DFW but does not create a third minority opportunity district in the Metroplex. There’s still another variation to examine, and it’s not like either of these.

From what I can tell, the difference between these maps and the Veasey/West map is that they eliminate the coalition district in DFW and create a Hispanic district in Harris. Otherwise, the political make up of the two maps looks the same to me.