
Note: From time to time, I solicit guest posts from various individuals on different topics. While I like to think I know a little something about a lot of things, I’m fortunate to be acquainted with a number of people who know a whole lot about certain topics, and who are willing to share some of that knowledge here. In this particular case, I’m welcoming back someone who has written on this particular topic before.
It’s July and that can only mean one thing: time to worry about my electrical contract for the next year. As we saw in last year’s installment, I ended up going with TriEagle Energy’s 100% renewable product. They want to jack my rates by 10% over last year, so clearly it’s time to run the numbers again.
This year, I decided to try to sort out what each plan would cost based on my power usage data for the past year (thanks again to SmartMeterTexas.com). For five months, my usage went over 1000 kWh/month and for seven it was well below. I then downloaded the full spreadsheet of available offers from PowerToChoose.org, built an equation to estimate my monthly charges, and then all I have to is sort to find the cheapest, right? Sadly, it’s not that easy. The spreadsheet data they give you is a disaster. Rather than just listing the fees, there’s now a textual column titled “Fees/Credits” and there’s no standard way in which they’re reported. Some companies report what you’d pay per kWh, inclusive of monthly fees, while others report what you pay exclusive of those fees. This meant I had to go through every row in the table and try to interpret their mumbo jumbo. Deregulation!
If you just try to just naively scale the 500 or 1000 kWh numbers, you end up with a wrong answer by 2% or more, but the EFLs often fail to give you enough data to do any better. So, with that caveat, here’s a histogram of how much money I’d spend in a year with each of the nearly 200 fixed rate electricity contracts on offer. Higher points in this histogram mean there are more plans that would end up costing me that price.
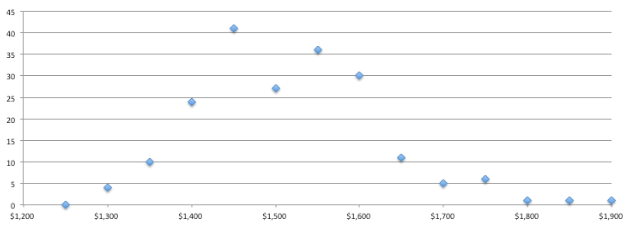
While I don’t want to name names for companies with unhelpful Electric Facts Labels and PowerToChoose-published data, I do want to give kudos specifically to Our Energy for doing it better. They say explicitly what CenterPoint expenses they are passing through, and they themselves have a flat rate on the power they’re selling. This allows me to calculate my real expenses, not a cheesy approximation of them. That would adjust them from $1316/year (as everything else in the histogram above is computed) to $1277/year, moving them into the top competitive position on my chart. Would others be cheaper as well? Probably, but PowerToChoose doesn’t give me enough information to choose. Should I reward Our Energy with my business for having the best and most transparent EFL? It’s tempting, but first, a rant…
Can’t we please go back to having a centrally regulated traditional utility company?
San Antonio still has this. I had a friend there send me a copy of her utility bill. She’s paying approximately $0.11 / kWh. Her bill breaks out the fixed and variable charges, much like I appreciate from Our Energy. On my histogram above, she’d be somewhere in the far left — getting an exceptionally good rate and not having to do this stupid analysis every year. All of our lovely free market competition in Houston is really just a series of opportunities for fools and their money to be quickly separated from one another.
Hey, what about solar power and saving the earth and stuff?
When I first started writing this year’s analysis, I said to myself, “Surely solar power must be a real option by now!” After way too much investigation, the short answer is, “maybe, if you can afford the big payment up front.” After spending the last month getting quotes and doing the research, I’m this close to pulling the trigger on a solar installation. Here are the high points:
Solar works hand-in-hand with the grid. When you install a solar system, it’s generating power during the day that you probably don’t need, and you need power at night that your solar system isn’t providing. This means your meter gets to run backwards during the day and forwards at night. If you have a month where you generated more than you used, you get a negative electric bill, which is then “banked” for future months. (Curious side-effect: you don’t want to over-size your solar system, because you’ll never get all your money back from the “bank”.) Also notable: if grid power goes down, so does your solar system. You can install a backup battery system or a gas-powered generator, but that’s a whole separate animal.
The financial incentives are okay, not great. In rough terms, the system I’m contemplating, which might generate 9-10 kW from the mid-day sun, will cost $20k after federal tax incentives. After that, you have small or even negative electric bills, and you start making money back on your initial investment. You stir in a bunch of assumptions about the depreciating value of the asset you’ve bolted to the roof, and you come out with a bottom line that you can look at with standard financial investment terms (internal rate of return, etc.). The proposal I’m considering from Texas Solar Outfitters would have an IRR of 7.4%, under their standard set of assumptions. Under different assumptions, you’re better off just getting power from the grid. (The same numbers in a place like California are in the “no brainer” category, both from additional up-front incentives and from the tiered electrical pricing they have. Solar helps keep you out of the higher tiers.)
What about leasing vs. buying, warranties, etc. In short, a lease is a lot like a loan. You’re paying less up front and you’re making monthly payments. The leasing company is trying to make money. The net effect is that the IRR goes down to the point that the deals are less likely to be worthwhile. (Again, this varies on a state by state basis. Nobody’s subsidizing those leases here.) Solar lease deals also act like an extended warranty on your gear. If your panels aren’t up to spec, they repair them for you. Most solar parts have very long warranties of their own, so this is less of a big deal than you’d think.
The environmental impact of solar is less abstract than the premium you pay for a “green” grid electricity plan. No matter what grid plan you purchase, green or not, the same mix of mostly coal and gas-fired generators are still producing the power your house is consuming. The only difference is that you’re paying your utility middleman to also buy you “renewable energy credits”, which are sold by wind farms and other such things and which may or may not be feeding their electrons to your house. It’s at best unclear whether you’re incentivizing somebody to install more “green” generation capacity versus building another traditional plant. On the flip side, when you’re turning sunlight into power, you’re directly removing your demand from the grid. This sort of logic is especially attractive if you’ve got an electric car and you’re worried about the “long tailpipe” emissions problem.
Aren’t you just a leach on the electric grid, then? Umm, no. By installing solar, you’re doing the grid a favor by supplementing its power during the peak draws in the hot summer sun. If more houses could run their meters backwards, that would effectively supplement the big generators and help avoid brownouts. Also, you’re paying the same monthly fee that everybody else pays for connecting to the grid.
So, what’s your new electricity plan then?
I need to pick a new electricity provider now, even though it might be a while before I can get a solar panel system installed on my house. The set of plans that support solar sellback is very small. So far as I can tell, I’ve got precisely three choices: Green Mountain, Reliant Energy, and TXU. The winner among these seems to be Green Mountain, who will buy your first excess 500 kWh/month from you at full retail price and half price thereafter. TXU buys from you at 7.5 cents/kWh no matter what. I can’t seem to find the Reliant number.
Green Mountain says you can sign up for any of their plans and switch without penalty to the plan that supports buying your power back from you, so that’s probably the way for me to go.
Dan Wallach is a professor of computer science at Rice and a friend of mine who has provided this annual analysis three times before.
Companies are starting to game the FACTS labels. The FACTS gives you the average price per kWh prices at 500, 1000, and 2000 kWh. Example @ 500 – 13.2 cents, @1000 – 11.0 cents and at @ 2000 – 9.9 cents. A consumer would see that and assume if my usage is between 1000 to 2000 kWh, my price will be 11.0 cents per kWh. But not so fast, some companies are now structuring prices with credits that kick in at the exact levels. So if you used exactly 1000 kWh, your price would be 9.9 cents. But go to 1049 kWh and those extra 49 kWh are charged at a higher base rate.
I think the FACTS label was designed to make prices easy for consumer to understand. I recently filed a compliant with Texas PUC on this issue.