
Houston-area leaders love to trumpet the region’s affordable cost of living and low taxes, but the costs of sitting in traffic are taking a record share of workers’ incomes, according to a comprehensive annual study.
The average peak-period commuter in Houston pays $1,490 annually in lost time and wasted fuel because freeways are not flowing, according to the Urban Mobility Scorecard. The scorecard, developed by the Texas A&M University Transportation Institute, assesses congestion in America’s 471 urban areas. It is considered a reliable barometer of whether traffic conditions are worsening or improving.
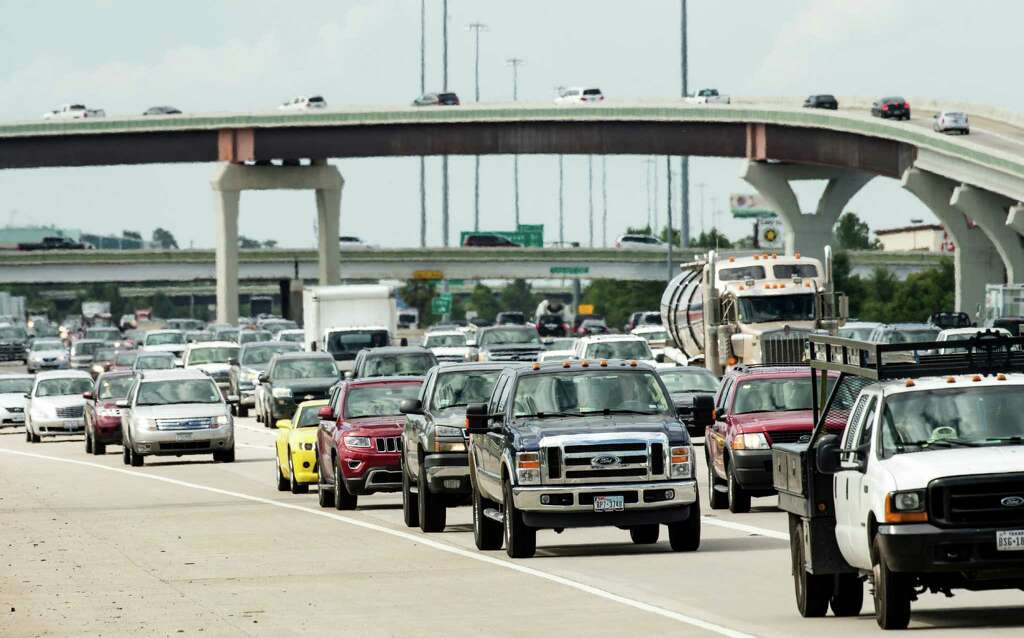
Congestion delays more than 2.4 million commuters daily along the Houston region’s 90,000 lane-miles of streets and highways, the study found. Though nearly the same number of workers traveled in the area daily in 2012 and 2014, last year motorists collectively sat in traffic for more than 200 million hours for the first time. This means every worker in the Houston area who travels at peak times wastes on average 61 hours annually because traffic doesn’t move as intended.
[…]
Despite having a lower cost of living than many other congested urban areas, Houston ranks fourth nationally when the cost of congestion is calculated. The area’s total wasted time and fuel value is $4.9 billion annually; an estimated 94.3 million gallons of fuel are lost to stop-and-go traffic.
Freight movement also suffers. Congestion adds $1.1 billion annually to the price of delivering and shipping goods via truck, according to the scorecard. Only New York, Los Angeles and Chicago shippers lose more money to congestion.
Even adjusting to the value of $1 in 2014, the money lost to commuting is at an all-time high in Houston. With a more diverse economy and growth seemingly inevitable, experts do not expect the cost of congestion to decline.
“If Houston grows by a million people, just keeping that at $1,500 is going to be hard,” [scorecard co-author Tim] Lomax said.
Here’s the scorecard and press release, with additional commentary from The Highwayman. I’m sure all of this will sound familiar.
What may not be so familiar is this critique of the study:
The trouble with TTI’s work is that, to put it bluntly, it’s simply wrong. For one, their core measure of congestion costs — the “travel time index” — only looks at how fast people can travel, and completely ignores how far they have to go. As a result, it makes sprawling cities with fast roads between far-flung destinations look good, while penalizing more compact cities where people actually spend less time — and money — traveling from place to place. These and other problems, discussed below, mean that the TTI report is not a useful guide to policy.
Moreover, its authors have been consistently indifferent in responding to expert criticism, and the report has not been subjected to peer review. The authors continue to report data for 1982 through 2007, even though TTI’s model for those years doesn’t actually measure congestion: it simply assumes that increased vehicle volumes automatically produce slower speeds, which is not necessarily accurate. The report’s data from 2007 and earlier isn’t comparable the data that comes afterwards, and can’t legitimately be used to make claims about whether traffic is better or worse than in earlier periods. And for decades, TTI used a fuel consumption model to estimate gas savings that was calibrated based on 1970s-era cars, and which assumed that fuel economy improved with higher speeds — forever.
At City Observatory, we’ve spent a lot of time digging through TTI’s work and similar congestion cost reports. A summary of our work is in the City Subjects card deck “Questioning Congestion Costs.”
Click over to see the summary of what City Observatory learned. More along these lines comes from Transportation for America:
The report focuses only on drivers — not commuters as a whole. The millions of people using growing modes like transit, walking or biking or skipping the trip entirely by telecommuting at peak aren’t included in the analysis. So when the report says “person” or “commuter,” what they’re really saying is “car commuter.” The nearly 1 million trips taken per day in Washington, DC —#1 on the “list of gridlock-plagued cities — on metro (bus and rail) and therefore not in a car? Not included in this analysis.
Trips not taken can be crucial, yet they’re ignored here. In February 2009, Inrix, the company partnering with Texas A&M on this release, reported that just a 3.7 percent drop in vehicle miles traveled in 2008 resulted in a 30 percent drop in congestion in the 100 most congested metro areas. We don’t need everyone to shift their trip, take transit, move closer to work, or telecommute — among many possible options. But smart investments and incentives that lead to very small reductions in trips taken can have huge benefits in reduced congestion. And they’re often far cheaper than massive projects proposed to shave a few seconds off of average commutes.
Live close to where you work? Oops. Your short commute can come out looking worse than someone else’s much longer commute. TTI completely ignores the actual time and distance of commutes. If you have a 20-minute commute home but move at a lower speed, your commute scores worse than the person driving 80 minutes at a higher speed. Yet who has the better experience each day?
[…]
Ranking congestion is fine, but what should we do about it? How can we manage congestion in the most cost-effective way possible given limited transportation dollars?
Doing more of the same certainly won’t solve the problem. Regions that have been aggressively investing in additional travel options, eliminating trips, reducing trip length, creating more places to live close to jobs or more effectively managing demand have seen their congestion numbers get better, according to this landmark CEOs for Cities report from a few years ago.
That’s why it’s so critically important that the rule for the congestion performance measure being developed by USDOT measure success (or failure) in ways beyond just this limited and flawed TTI measure. We do need a better measure of congestion if we want to avoid making the same decisions that got us into this mess.
How far do most people have to travel for work? How long does it take them? What is most effective at reducing the amount of time it takes to get places? How many people are exposed to the congestion? Congestion may be bad, but people telecommuting, in a vanpool or on a bike might not experience it. Credit should be given to areas that allow people to opt-out of the traffic. Those are the kinds of metrics we need to use in order to find real solutions.
I’d fall into that third group above – whether we take I-45 or Houston Avenue, we move pretty slowly going into downtown most days, but we don’t have far to go, and it almost never takes more than 10 minutes total. Tiffany used to take a vanpool to The Woodlands for her job. She moved a lot faster, but was on the road a lot longer. Which would you rather do?
Just a little food for thought while you’re sitting there in traffic. I’ve said before and I’ll say again, we are reaching the end point of accommodating single-passenger-vehicle drivers. We don’t have the room to build more highway lanes in our cities, and in the places where we have done so recently, they’ve just filled right back up again. Just as we can’t economically meet our state’s water and energy needs without conservation, we can’t economically meet the needs of single passenger vehicles at the current pace. The focus has to be on reducing the number of cars on the road – more carpools, more transit, more biking and walking, more telecommuting – which is to say, on conserving road capacity. We’re too cheap to pay for anything else anyway, so we may as well embrace the option that we’re forcing ourselves into. Street Smart has more.