
FiveThirtyEight goes a little nuts.
The max Dem map
Drawing clever political districts is one way politicians in Texas and elsewhere avoid accountability — by protecting themselves from voters who disagree with them. They do this by stuffing weirdly shaped geographic districts with voters who agree with them.
A new examination of redistricting shows how effective legislators have done that nationally — and in Texas, and how changing the rules for drawing political maps could dramatically change who represents you at the state and federal Capitols.
FiveThirtyEight unleashed a fascinating series of maps for their Gerrymandering Project series Thursday as the U.S. Supreme Court considers several cases that could solidify or disrupt redistricting practices in Texas and other states. In two closely watched cases, the court is deciding whether it’s possible — as a matter of law — to draw political districts that are so partisan they strip voters of their constitutional rights.
The data-centric news site crunched the numbers and lines and devised seven different ways to draw congressional maps for all 50 states: maximizing Republican seats; maximizing Democratic seats; matching each district’s partisan lean to that of the state overall; maximizing the number of highly competitive seats; drawing the greatest possible number of seats with minority-majority populations; drawing the most compact districts possible, using a computer algorithm; and drawing the most compact districts possible while crossing county lines as few times as possible.
They also offered up a full explanation of how they did it. It’s worth noting that they make no claims as to the legality of their maps — whether federal judges would approve of either their assumptions or the results.
What’s really interesting is how each set of new rules would change the maps.
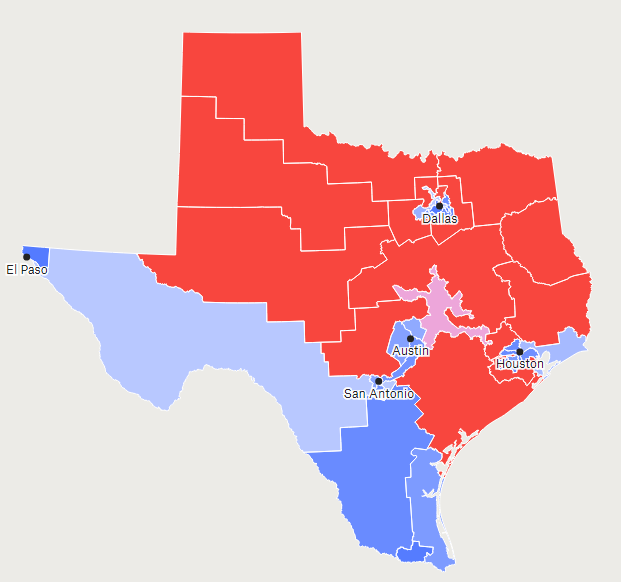
The Trib story goes on to summarize the results for Texas, but I’d say at this point you should just click over and view the maps yourself. As you can see, it is possible (among other things) to draw a map where Democrats win a majority of the seats. As I recall from way back in 2003, during the DeLay re-redistricting saga, someone – it may have been Rep. Eddie Bernice Johnson, I don’t recall and don’t feel like looking – submitted a map that would have done something similar. Some of these maps would likely be illegal, some are aesthetically unpleasing, some would leave a large number of voters feeling disenfranchised, but all are at least theoretically possible. Take a look and see what you think.
I will just add, redistricting is a multi-dimensional task. Sure, if all you care about is partisan maximization, there’s not much else to consider. But in the aspirational world of non-partisan redistricting committees, there are a number of factors to consider. Districts still have to obey the Voting Rights Act, which can lead to some odd district shapes (see, for instance CDs 18 and 33 in our current map) as neighborhoods with high levels of minority voters are stitched together to ensure compliance. Other considerations like communities of interest, compactness, and competitiveness can pull things in opposing directions. Is it better to keep cities whole as much as possible, or is it better to have more members of Congress who have constituents that live in that city? There’s room for debate. Check it out and have fun.