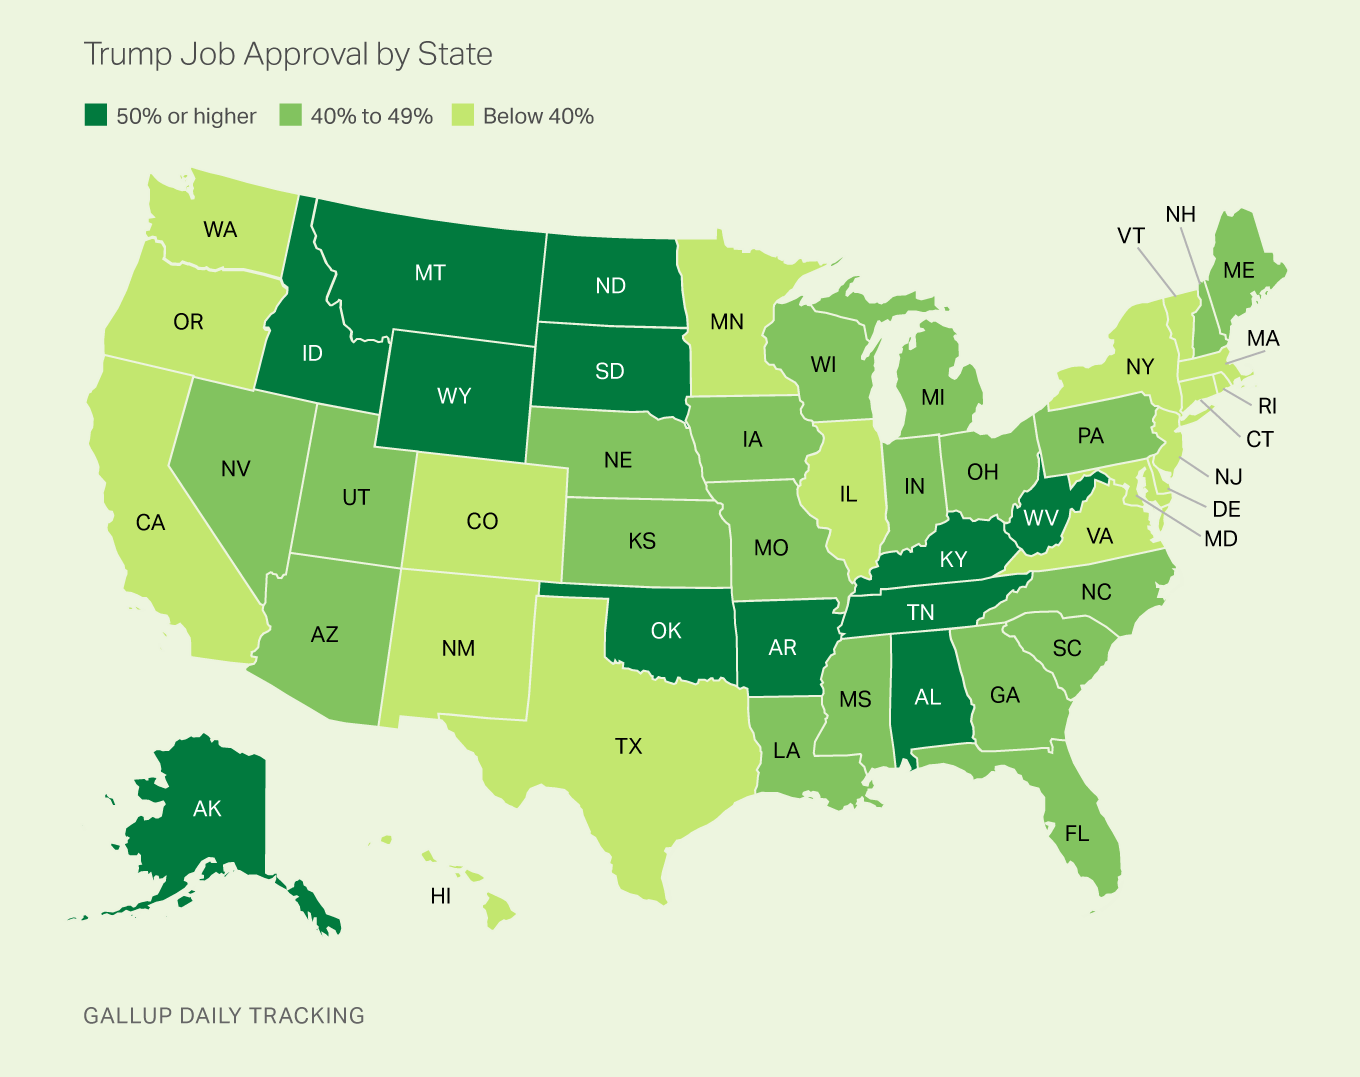
President Donald Trump’s job approval rating averaged 38% throughout the U.S. in 2017, but at the state level it ranged from a high of 61% in West Virginia to a low of 26% in Vermont.
Trump averaged 50% or higher approval in 12 states in total, primarily in the states where he received the most votes in the 2016 election. In addition to West Virginia, the states where at least half the respondents approved of Trump included several western states (Wyoming, Idaho, Montana and Alaska), several southern states (Oklahoma, Alabama, Kentucky, Tennessee and Arkansas) and two Midwestern states (North and South Dakota).
Trump earned between 40% and 49% approval — above his national average — in 20 states. These were predominantly in the Midwest and South, and included several of the key rustbelt states that were critical to his 2016 victory: Ohio, Pennsylvania, Wisconsin and Michigan.
Fewer than 40% of respondents approved of Trump in the remaining 18 states, 14 of which are located in the East and West — his worst performing regions in the election. In addition to Vermont, his ratings were particularly low — below 30% — in Massachusetts (27%), California (29%) and Hawaii (29%). Maryland, New York, Connecticut and Rhode Island round out the states where fewer than one-third of the respondents approved.
Texas fell into that latter group, with 39/54 approve/disapprove totals. That’s worse than in some states carried by Hillary Clinton in 2016. For comparison with other polls:
UT/Trib, February, 46 approve/44 disapprove (poll of RVs)
Texas Lyceum, April, 42 approve/54 disapprove (poll of adults)
UT/Trib, June, 43 approve/51 disapprove (poll of RVs)
PPP Senate poll, January, 45 favorable/48 unfavorable (poll of RVs)
The Wilson Perkins poll did not have any publicly available favorability/approval data. Favorable/unfavorable is not quite the same as approve/disapprove, but it’s what we’ve got for that PPP poll. This Gallup result is quite in line with the Lyceum result, with slightly lower approval, and it’s not far off from the later UT/Trib survey. Polls of adults are the loosest screen, and thus contain the largest number of likely non-voters, but that’s a function of motivation, and it sure looks like the anti-Trump faction is more full up on that. The standard disclaimers apply as always, my point here is simply to keep these numbers in mind when we see things like other poll results, as Trump’s favorability is certain to be a factor in how they shake out. Ed Kilgore has more.


Look John, Charles, Kenny, Steven, whatever your name is the only poll that counts is the one held on election day, called the election. If November 2016 taught you anything, your polling data is wrong and will always be wrong.