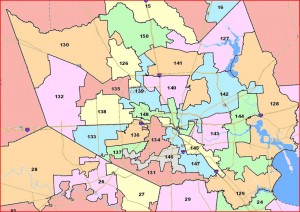
For our last stop on this tour we look at Harris County, which provided several pickup opportunities for Democrats last decade. How will they fare this time around?
Republicans started the last decade with a 14-11 advantage – they intended it to be 15-10 after drawing Scott Hochberg out of his seat, but he moved into HD137, drawn at the time to be a 50-50 district, won it, and watched it grow more Democratic with each election. Democrats picked up seats in 2004, 2006, and 2008, then lost two of them in 2010, ending the decade at a 13-12 disadvantage. This map shrinks the Harris delegation to 24 seats and in doing so forces the only Dem-on-Dem pairing, as Hochberg and Hubert Vo were thrown together. At this point I don’t know who is going to do what. I’ve heard rumors about Hochberg moving to 134, which includes a fair amount of turf from his pre-2001 district, but that’s all they are. We won’t know till much later, and I doubt anyone will commit to a course of action until the Justice Department has weighed in.
Assuming there are no changes, the Republicans had some work to do to shore up their members. With the current map, Jim Murphy in 133 and Sarah Davis in 134 would be heavily targeted, with Dwayne Bohac in 138 and Ken Legler in 144 also likely to face stiff competition. By virtue of shifting districts west, where the population has grown and where the Republicans have more strength, they bought themselves some time. Here’s a look at the 2004 Molina numbers for the old districts versus the 2008 Sam Houston numbers in both the old and the new ones.
Dist 04 Molina  Old Houston  New Houston
========================================
126       32.9         42.0         37.9
127       28.3         33.3         32.4
128       35.5         38.9         38.0
129       33.4         36.8         38.6
130       23.6         29.5         26.4
132       30.3         41.4         40.6
133       44.0         51.2         41.6
134       43.3         44.7         42.6
135       35.5         42.1         39.5
136       28.1         31.7         40.0
138       41.1         44.8         40.3
144       39.9         45.1         42.1
150       28.4         36.4         33.0
A couple of massive shifts, in 133 to protect Murphy, and in 136 where Beverly Woolley gave up some turf to help out Bohac and Davis. Some Democratic districts got even bluer, though not all of them; losing a district allowed voters of all stripes to be spread around more. Woolley and Davis’ districts cover neighborhoods that are unlikely to change much, so what you see there is likely to be what you’ll get. Everywhere else, especially in the western territories – 132, 133, 135, and 138 – are likely to see change similar to what we saw last decade. I wouldn’t be surprised if their partisan numbers are already different. The question is how much time have the Republicans bought themselves, and how much effort and resources the Democrats will put into reaching the new residents out there; not much had been done in the past. Other than perhaps Davis, who will surely be attacked for voting mostly in lockstep with the rest of the Republicans, it’s not clear that any of these seats are winnable next year, but the results we get at that time may tell us when they’ll be ripe for the picking. I expect we’ll see some turnover over time, but I don’t know how much.


According to my spreadsheet, Democrats are going to have to win districts in which the Best Dem percentage is 42% or higher. That would give them their current membership (49), a sweep in the Southern non-urban districts (6), a sweep in the Central non-urban districts (6), each of the Travis, Bexar, and El Paso swing districts (3), 96 and 101 in Tarrant (2), a sweep in Dallas (8), and 134 and 144 in Harris (2) for a total of 76 districts. That sounds like a lot of work, but a decade is a long time.
In my previous comment, I counted both Vo and Hochberg, so +8% only gets us to 75 seats.