What’s happening in other parts of Texas is happening in West Texas, too.
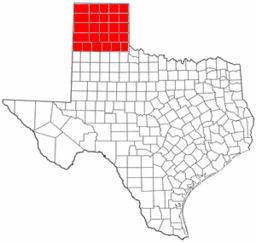
Whites no longer are the majority group in 17 counties in the Texas Panhandle/South Plains region, including Potter County, according to U.S. Census Bureau estimates. And based on current population growth rates, in at least four other counties, including Lubbock, non-Anglos could be in the majority by no later than the end of this decade.
The Census estimate showing nonwhite — mostly Hispanics — now in the majority in some of the most populated counties in the region did not surprise Amarillo City Commissioner Lilia Escajeda.
“I’ve seen it over the years and it’s growing here and all over the state,” said Escajeda, who lives in Randall County, the only one of the three most populated counties in the region still predominantly white.
“And what it means is that there are more opportunities,” she said. “We have a lot of new entrepreneurs who are opening new businesses in this part of the country.”
[…]
[T]he latest figures show that in eight counties — Castro, Deaf Smith, Garza, Hansford, Moore, Ochiltree, Parmer and Yoakum — immigration has fueled Hispanic population growth. In those counties, the percentage of foreign-born residents is higher than the state’s average of 16.1 percent, from 17.3 percent in Hansford to 31 percent in Garza.
In Deaf Smith County, 51 percent of the residents do not speak English at home; in Castro, Garza, Moore and Parmer counties, the percentage is just under 50 percent, considerably higher than the state average of 34.2 percent.
The high percentage of Hispanics also is more noticeable in rural counties that have lost population since the late 1950s — especially in Cochran, Hansford, Lynn and Terry.
[…]
Demographic growth also means challenges for the region and state, and none more important than education, Escajeda, Salinas and Shaw agreed.
“If we don’t succeed in educating our children, we will fail as a state,” said Escajeda.
That much is certainly true everywhere. We’re obviously a longer way away from this population shift having a significant effect on the politics of these counties, and given the time frame it’s impossible to say what that effect will ultimately look like, but it’s coming. Just to get a picture of the current electoral situation, here’s a look at the last three Presidential results in the counties named in this story:
County        04 Kerry  08 Obama  12 Obama
==========================================
Castro           26.0%     31.4%     29.7%
Cochran          22.4%     26.1%     27.9%
Deaf Smith       21.4%     26.3%     28.8%
Garza            18.0%     21.4%     17.7%
Hansford         11.2%     11.4%      8.1%
Lubbock          24.1%     31.3%     28.8%
Lynn             24.6%     29.6%     25.0%
Moore            17.9%     20.6%     19.3%
Ochiltree         7.9%      7.8%      8.4%
Parmer           14.0%     19.3%     20.7%
Potter           25.8%     29.8%     26.9%
Randall          16.2%     18.3%     15.2%
Terry            20.0%     32.2%     28.6%
Yoakum           14.4%     18.3%     19.2%
Still a ways away from being purple, let alone blue, but a teeny bit less red. Note that even in a year where Obama’s vote total declined overall and he lost over two percentage points statewide, he still improved his showing over 2008 in five of these counties, and improved over John Kerry in all but three of them. It’s a journey of a thousand miles, but whether we realize it or not the first step or two have been taken.

