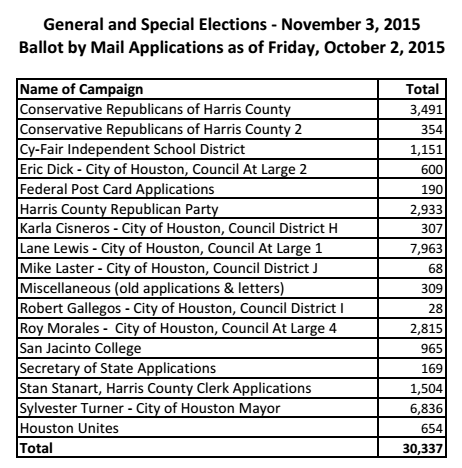
Carl Whitmarsh forwarded me a breakdown of all mail ballot applications that have been received by the County Clerk’s office as of Friday, October 2. I saved the file here, but for ease of discussion here’s a screenshot:
That’s a grand total of 30,337 mail ballot applications, with 14,799 of them coming from Lane Lewis and Sylvester Turner. The question as always with this sort of thing is how does it compare? Is it a sign that something unusual is happening, or is it more or less what we might expect?
The simplest way to answer that question is to look at the totals from the last election. Here they are for 2013. As of the end of early voting that year, some 30,672 ballots had been mailed, and 21,426 had been cast. That’s…almost identical to the number of mail ballots sent out this year.
Now that total is as of November 1 – the last day of early voting – that year. We’re still four weeks from Election Day. It’s certain that the mail ballot total will be higher at the end of early voting this year. If you take a closer look at that 2013 EV spreadsheet, you will see that the total number of mail ballots sent as of the start of the EV period, which in 2013 was October 21, 28,620 absentee ballots had been sent. We are definitely ahead of that, though not by that much. If mail ballots are sent out during the next three weeks at about the same rate as they were during the first week of early voting in 2013, we’ll probably wind up with about 36 or 37 thousand in all. That’s a respectable increase, in the 20% range, but not that much in absolute terms. And as I frequently mentioned in 2014, a lot of these new voters-by-mail are likely to be people who voted reliably in person before. I would be very hesitant to suggest that this by itself is indicative of an increase in turnout.
Keep two other things in mind, too. One is that not all mail ballots that get sent out wind up getting returned. If we assume that the final total of ballots sent out in 2013 is 30,337 – a reasonable guess since the cutoff day for applying for a mail ballot is a few days before the election – then we can see that 24,022 of those ballots were returned. That’s about an 80% return rate, so if we wind up in the neighborhood of 36,000 ballots sent, expect about 29,000 of them to come back. Note also that not all of these ballots were from city of Houston voters. Some 20,297 mail ballots from Harris County were cast in the 2013 Mayor’s race. That’s 84% of the total, so notch that 29,000 down to 24,500 or so. (For comparison, 67% of all Harris County ballots in 2013 came from the city of Houston.) Again, an increase, but hardly a flood.
Can this change? Sure it can. There’s no reason to believe that the “mail ballots sent” function is linear. It could be that we see a disproportionate number of such ballots sent between now and October 19. I’ll know when I see the first early voting daily total for this year. It could also be that there’s an increased focus on getting absentee ballots out to people who vote regularly in even-numbered years, but not odd-numbered years. Again, we should have some idea about this from the daily roster of early voters. I reserve the right to change my mind, but so far I don’t see anything that swings my opinion one way or the other on What This All Means for this year’s election.
One more thing: If you look at those totals embedded above and count up the number that came from clearly Republican/conservative sources, you get 10,193 all together. (I am not counting the 1,504 that are labeled “Stan Stanart, Harris County Clerk Applications”, as that appears to be the total from applications received from the County Clerk website.) Once you account for the 80% return rate and the 84% City of Houston rate, you get 6,882. The total number of mail ballots that originated in Council districts A, E, and G in 2013 was 8,018. This is not an apples-to-apples comparison by any means – Republicans live in all districts, and non-Republicans live in those three – but it suggests there isn’t a surge in Republican mail ballot applications, at least at this time. Again, things can change, there’s still time, your mileage may vary, and so forth. All I’m saying is that so far these are fairly boring tea leaves to read.


Maybe these are 30,000 voters who don’t have a Texas ID or Texas DL, but still want to vote? After all, we were told there were going to be tens of thousands of newly disenfranchised voters because of the ID requirement to vote.
You were told accurately, Bill:
“Around 600,000 registered Texas voters don’t have one of the limited forms of ID that the law allows, according to evidence presented in the legal challenge to the law, which was brought by civil rights groups and the Justice Department. The state did almost nothing to challenge that assessment. That means there’s no doubt whatsoever that the law disenfranchised legitimate voters.”
Now let’s hear some grousing about the source.